Cryptocurrency, the latest buzzword in the investment sector, has piqued the interest of traders worldwide. While it can yield considerable profits, it comes with its fair share of volatility. The key to mastering the art of trading cryptocurrency lies in understanding the live cryptocurrency graphs. These critically important analytical tools provide a real-time overview, facilitating informed decisions. Let us dive deeper into these visual representations and shed some light on the world of digital currencies.
Understanding the Concept of Live Graphs in Cryptocurrency
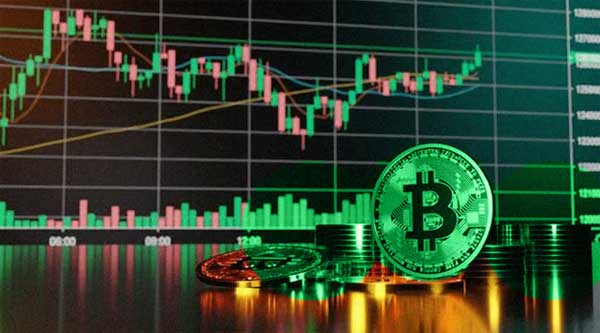
Live graphs are dynamic charts that present data in real time. In the ever-evolving world of cryptocurrency, live graphs play a critical role. They provide vital information, such as price fluctuations, trading volume, and historical performance of various cryptocurrencies. These graphs update continuously as new information surfaces, giving traders instant access to the latest market trends. Their ability to track price movements in real time can help investors better anticipate and navigate the unpredictable crypto market.
Comprehensive Overview: Role of Live Graphs in Cryptocurrency Trading
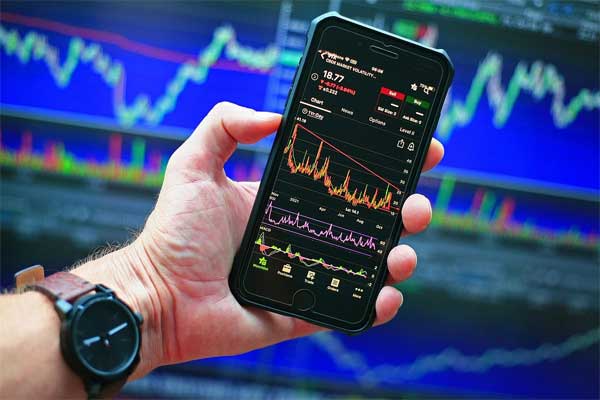
Live cryptocurrency graphs serve many crucial functions in trading. Firstly, they provide insights into the current state of the market, aiding traders in making informed decisions. Secondly, they help predict future market trends based on historical data and patterns. They illustrate various indicators, such as resistance and support levels, moving averages, and relative strength index (RSI) — toolkits used by traders to strategize their moves. Also, live graphs are essential for day traders who depend on real-time data for quick-selling and buying decisions.
Decoding the Language of a Live Cryptocurrency Graph

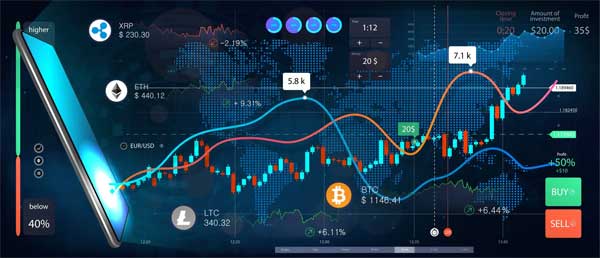
Mastering the language of live graphs is key to understanding cryptocurrency trading. The “price” directly shows the current value of the cryptocurrency. “Volume”, another main component, displays the number of coins traded during a selected duration. In addition, live graphs include “candlestick patterns”, which provide information regarding opening and closing prices, as well as the highs and lows in a given period. Furthermore, features such as the “relative strength index (RSI)” indicate whether a cryptocurrency is overbought or oversold – a crucial deciding factor for buying or selling.
Tools and Techniques: How to Read a Live Cryptocurrency Graph
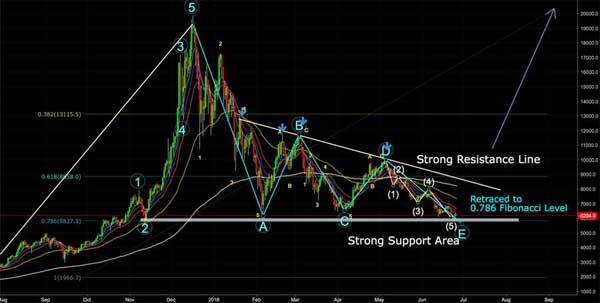
To successfully navigate through a live cryptocurrency graph, few key tools and techniques are indispensable. It starts with understanding the “Timeframe”, which allows traders to adjust the time period of the graph, providing a broader or more precise view. The “Zoom feature” can be used for a more detailed view of specific time windows. “Candlestick patterns” and “Bollinger Bands” can provide insights into potential market directions. Also, tools like “moving averages”, “relative strength index (RSI)”, and “Fibonacci retracement levels” can help predict potential future movements.
Live Cryptocurrency Graph vs. Historical Data
| Live Cryptocurrency Graph | Historical Data |
|---|---|
| Provides real-time data | Provides static, past data |
| Essential for day traders | Useful for long-term investors |
| Reflects current market emotions | Reflects past market performance |
| Regularly updated | Not frequently updated |
The Impact of Live Cryptocurrency Graph on Market Predictions

Live cryptocurrency graphs can profoundly impact market predictions. By displaying real-time data, they allow traders to keep a finger on the pulse of the market. The live graph’s real-time nature enables traders to act swiftly and capitalize on short-lived opportunities that could be missed with delayed data. By providing insights into price patterns, trends, volume, and volatility, live graphs can help traders make informed decisions and forecast potential market movements.
Future Trends: The Evolution of Live Graphs in Cryptocurrency

With the rapid advancements in technology, live graphs are bound to evolve and become more efficient. Future trends may see graphs with enhanced prediction functionalities, incorporating artificial intelligence and machine learning for data analysis. Real-time alerts and notifications are likely to become more prevalent, providing traders with instant updates on their chosen cryptocurrencies. Given the volatile nature of digital currencies, innovations in live graphical representations could significantly impact the ways we trade and invest in cryptocurrencies.
In conclusion, understanding live cryptocurrency graphs is instrumental in mastering the art of cryptocurrency trading. They provide valuable real-time data, aiding traders in making informed decisions and predicting market trends. While the crypto market’s volatility may seem daunting, the proper use of live graphs can turn it into an opportunity for profit. As technology continues to advance, we can only expect these vital tools to become more refined, further facilitating the world of investment in digital currencies.


Understanding live graphs can help in making better trading decisions. Nice read!
I didn’t know about candlestick patterns before. The article is really helpful.
I like how the article breaks down the components of live graphs. Very useful.
The future trends of live graphs with AI sound exciting. Keep up the good work!
Great information about the tools and techniques to read live graphs. Very insightful.
The comparison between live graphs and historical data is very informative. Thanks for this!
The article explains how live graphs are important for crypto trading. Good info for beginners.
Live graphs show real-time data. This is crucial for day traders. Well explained.